This month we decided to summarize the Ni cross-coupling photocatalysis literature in a short review. But we quickly realized that’s a terrible idea, because a. it’s a lot of work, b. does not sound all that fun, and c. has been done, repeatedly here, and here. Also, here. This is a long one. This is a short one. This one is in flow? This one is open access . This one’s just right. Instead, we decided to take on the much more enjoyable task and screen this chemistry with the Lucent360™.
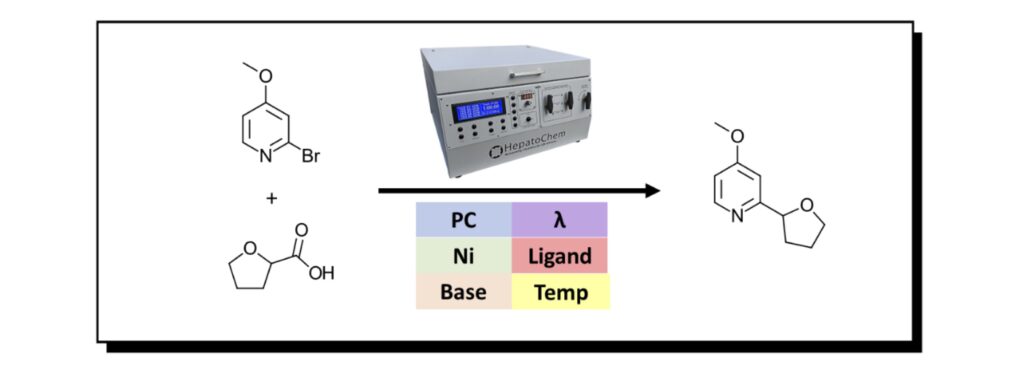
We’re interested in the transformation below, a photocatalyzed C-C bond formation via nickel mediated decarboxylation-dehalogenation. We chose a model bromopyridine substrate 2-bromo-4-methoxypyridine and a cheap carboxylic acid tetrahydrofuran-2-carboxylic acid which should give us an incredibly important compound that is used for the treatment of xxx (reference not found). Actually, it’s a nice (cheap) representation of two classes of compounds available by the thousands from your favorite chemical supplier.
Figure 1: Model reaction for this study using the Lucent360™
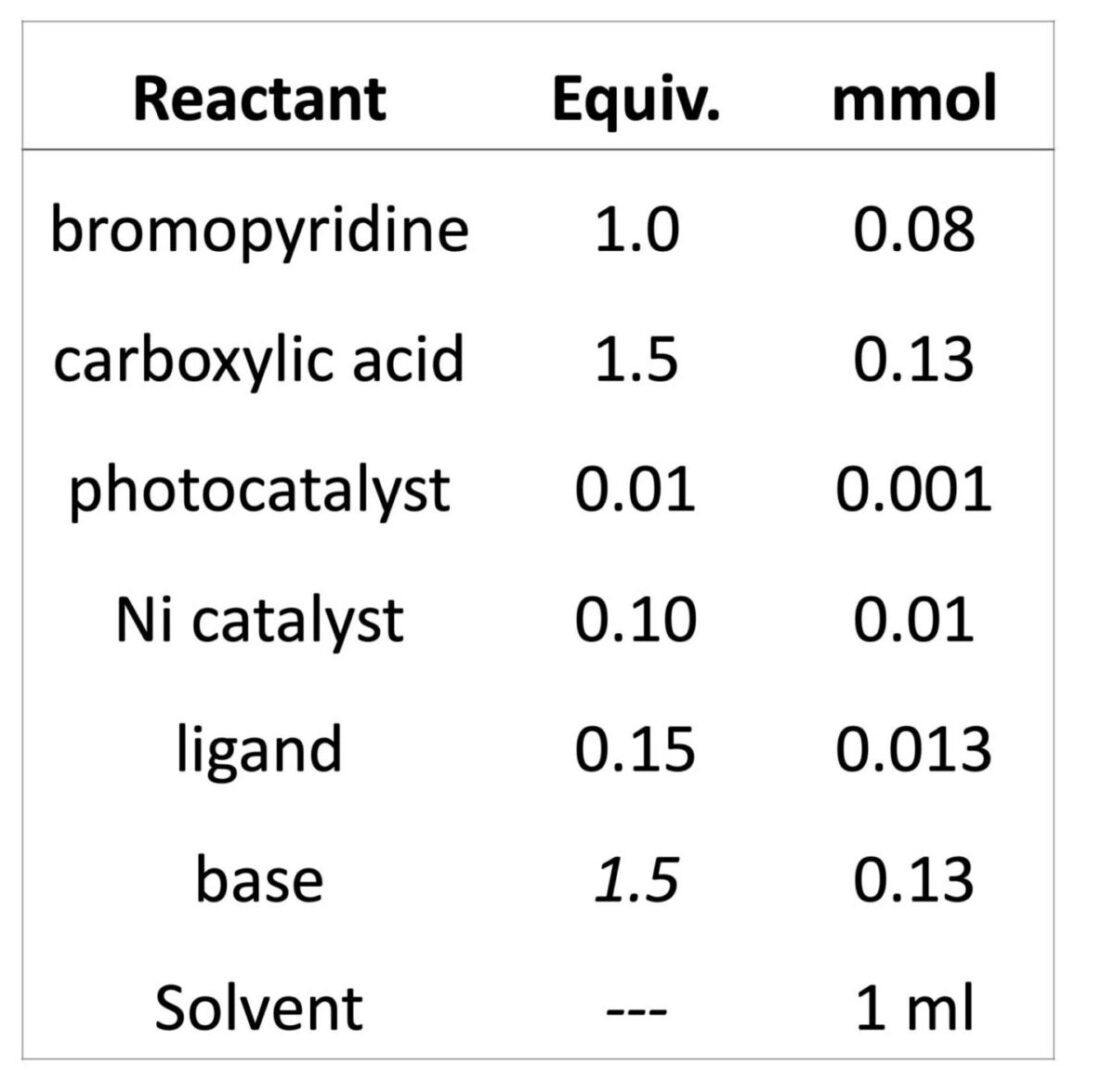
If you’ve read all the links above, then you know you have way too many options for where to start. If you are like us, then you probably made a list of the reagents, checked your shelf, and decided to just GO FOR IT!!! Especially if you have a few interns. To set this up, we know we need a photocatalyst, a nickel co-catalyst and maybe a ligand. A base is required. Our screening will follow the stoichiometry as described in Table 1. We chose to use 2 ml vials, for 1 ml reactions with DMA as a solvent. Why? Because it’s a good solvent and everything we want to test is fully soluble in it. We kept the concentrations and equivalents of each component consistent in each screen. The formal protocol is shown below.
Experimental details:
Each reaction was performed with 1 equiv. of 2-bromo-4-methoxypyridine (0.084 mmol) and 1.5 equiv. of tetrahydrofuran-2-carboxylic acid (0.127 mmol) with 1 mol % photocatalyst, 10 mol % Ni source and 15 mol % ligand with 1.5 equiv. base. Total volume of each reaction was 1 ml in DMA. Each reaction was performed in a 2 ml vial crimp vial with a Teflon septa cap. Reactions were prepared and capped in a N2 filled glove box using previously sparged DMA solvent. Reactions were performed in Lucent360 with 24x2ml sample holder at 30 °C for 2 hours. At completion of reaction, samples were diluted with internal standard in a suitable solvent for analysis by LC-MS. Based on the reaction parameter screen desired, photocatalysts, Ni source, ligand, base, light source, light intensity, and temperature were varied.
Table 1:
Lucent360™ Screen Experiment Protocol
Instrument Setup:
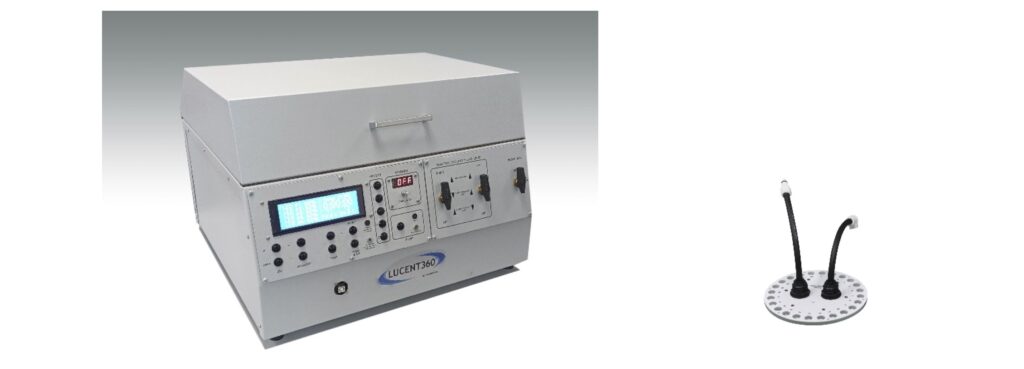
For the photoreactor, if you haven’t guessed, we are using the Lucent360™. This allows us to pick and choose different wavelengths, light intensity, and temperatures. Ultimately, we would like to find a reaction condition to make grams of this important compound or more accurately, find a reaction that we can use to write about the scale up capabilities of the Lucent360™ in batch and flow. Here we’ll use 365, 450 and 525 nm LEDs, however many wavelength options exist from 254 nm to 740 nm. We’ll use the 2ml x 24 vial-holder shown below, however vials ranging from 0.3 ml to 20 ml vials or quickly swap in our 700 ml reactor or flow cell with temperature control from 0-80 °C. An example of reactor parameters is shown in Table 2.
Figure 2: Lucent360™ Photo and 2ml x 24 vial holder
Table 2: Lucent360™ parameters
Catalyst and wavelength screen:
To start, we chose a set of 24 commercially available iridium, ruthenium and organic photocatalysts (see Figure 3). Each catalyst was prepared as a solution in DMA and added to vials containing the substrates, followed by a premixed NiCl2-glyme/dttbpy solution in DMA. The DBU was added, and vials were placed in the Lucent360™ with 4 x 450 nm side light LEDs modules set at 50% of intensity and temperature set at 30 °C for hours. After that, we swapped in 4 x 365 nm light modules and reran the same screen. Followed by 4 x 525 nm lights Why? Because we can and it’s simple to do.
Table 3: Catalyst data (see Figure 3 for catalyst structures)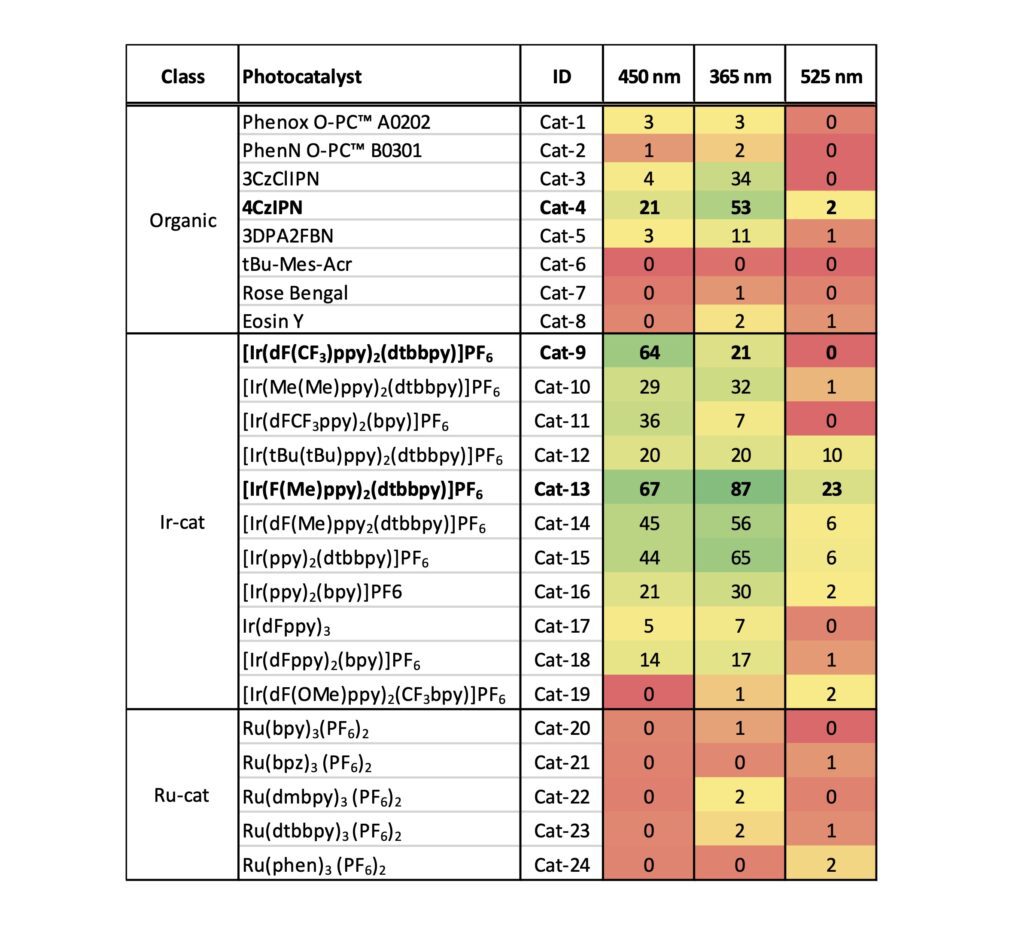
As expected for our in our catalyst/wavelength screen, some of the reactions worked, and others didn’t (now there’s a generic statement) although three catalysts stood out for various reasons. First, at 365 nm [Ir(F(Me)ppy)2(dtbbpy)]PF6 gave the highest conversion observed overall (87%) while also giving the highest conversion at 450 nm (67%). [Ir(dF(CF3)ppy)2(dtbbpy)]PF6 gave us a high conversion at 450 nm and for selfish purposes is a catalyst that we have a ton of for further use (practical considerations). While showing a decent conversion at 365 nm, 4CzIPN is of interest for us in terms of finding a metal free condition to scale up. Most of the iridium catalysts were at least moderately successful at 365 nm or 450 nm, although a few surprised us by failing. Each were significantly weaker at 525 nm. In this setup, the ruthenium catalysts were completely unsuccessful at all 3 wavelengths, while a few of the organic catalysts such as 4CzIPN and 3CzClIPN were moderately successful at 365 nm, while others were likely poor matches for the Ni chemistry and/or the DBU base.
One important note, the conversions here are likely artificially lower than you might expect for several reasons, and we have no doubt that the conversions for many of these conditions can be improved drastically. First, we intentionally ran each condition at 50% light intensity to best differentiate between catalysts. Second, for time considerations we arbitrarily stopped all reactions at 2 hours. Monitoring the a time course with variation of light intensity will likely be very informative. We have no doubt that many of the successful reactions will proceed to near completion under more ideal conditions as observed in much of the literature cited above. Perhaps those are the perils of selecting a reaction that works too well.
Ligand Screen:
We chose to screen each of our 3 new favorite photocatalysts with 16 ligands at 450 nm (see Figure 4). Here, we found that dtbppy (L2) is a great ligand as one would expect. And likely the only ligand you may need for this specific reaction. Also, d-OMeBPY (L9) gave the highest conversion for this set of screens with [Ir(F(Me)ppy)2(dtbbpy)]PF6 (68%) and tButerphenyl (L16) 65% were successful, although neither significantly improved to counter the difference in cost. Some of the conversions here are lower than we might have expected based on the catalyst screen and may be due to the premixed Ni-ligand solutions prepared for the use in these screens. Of high importance is repeating this set of experiments at 365 nm.
Table 4: Ligand screen data at 450 nm (see Figure 4 for ligand structures)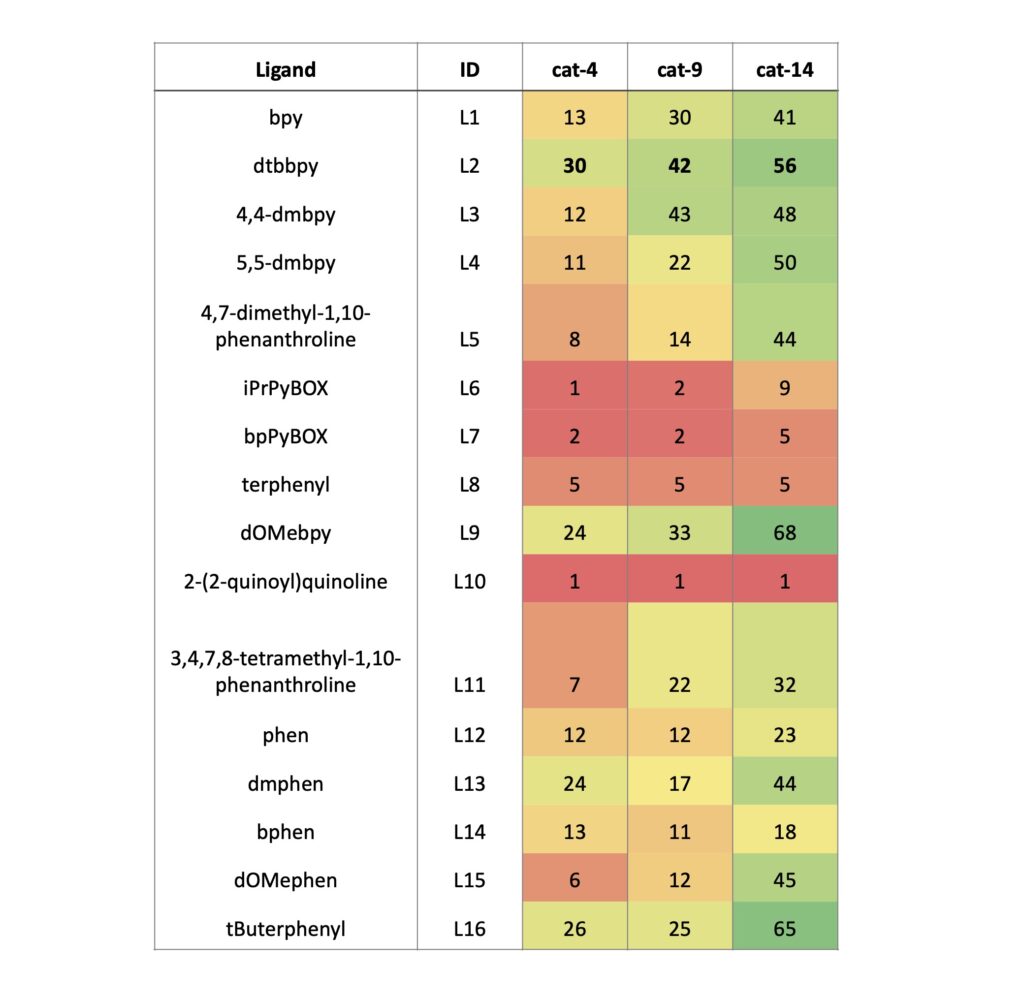
Base:
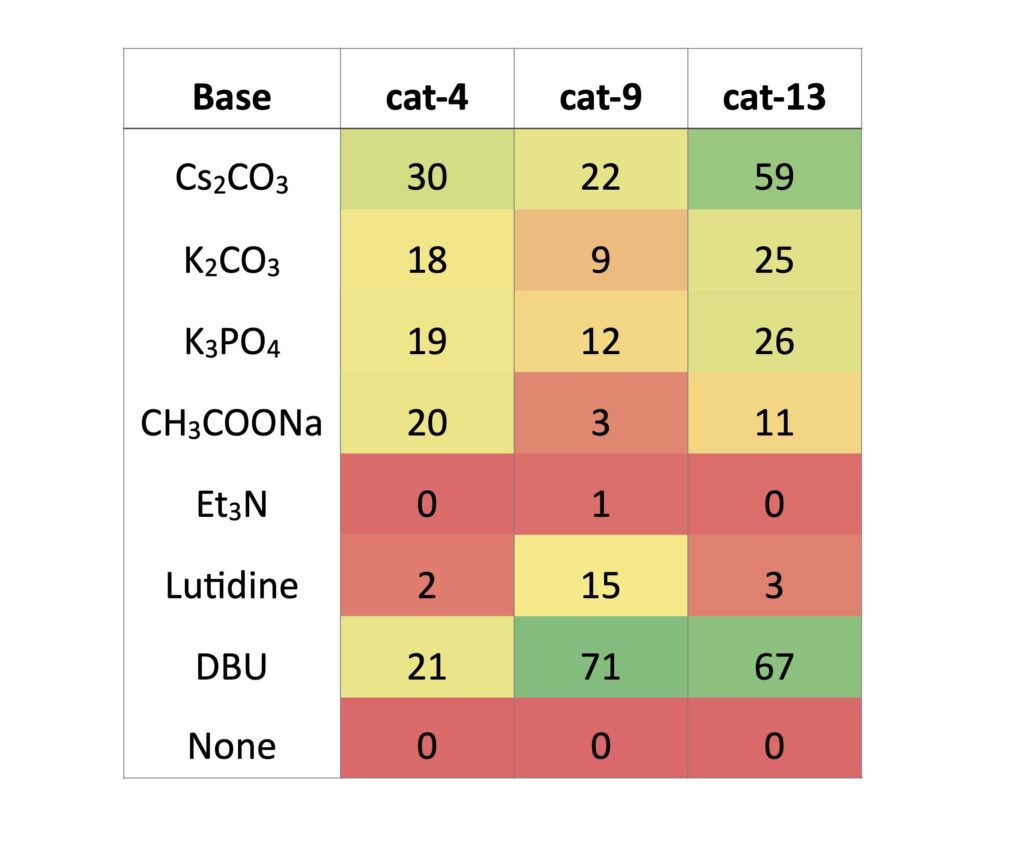
Finally, we chose 7 bases and 1 control to screen for each of our 3 catalysts. Here the nature of the bases requires many to be individually weighed into the vials. As such even though both Cs2CO3 and DBU were successful, the ease in handling and potential for adaptation to flow suggests DBU is still preferable.
Table 5: Base screen data at 450 nm
 In Summary:
Did we run a bunch of reactions to show you that Ir(dF(CF3)ppy)2(dtbbpy)]PF6 is a good photocatalyst, dtbbpy a good ligand and DBU a good base? Yes, we did. Did we all have a good time giving our Lucent360™ a good test run? Also, yes. So, what’s next? We have 3 catalysts that we will look to run at larger scale and test parameters such as light intensity, temperature and catalyst loading for scaling up. Hopefully in one big batch with a comparison to the reaction in flow. More on that shortly.
But after screening just these parameters, what did we learn about the potential of using the Lucent360™ for a new hypothetical bromopyridine and carboxylic acid that might have greater importance than our model system product? Could we design a better screen by mixing and matching LED modules to catalyst, for example 450 nm with an Ir catalyst, 365 nm with 4CzIPN or matching a base to catalyst or light intensity. Using the Lucent360™, you can choose your own adventure.
Figure 3: Photocatalyst structures

Figure 4: Ligand structures


