Screening light intensity for a photochemical Arbuzov reaction
Description
With the Lucent360™ you can perform screening photon flux Intensities with up to 4 four light intensities in one experiment, while also controlling for temperature. In this note, we demonstrate the setup of a screen using 365 nm LEDs at four light intensities for a photocatalyzed Arbuzov reaction, which along with chemical actinometry data allows for the determination of the quantum yield of the reaction.

Instrument Configuration
The Lucent360™ includes four side LED modules and one bottom module that are independently controlled and fully interchangeable allowing a multitude of configurations for wavelength and light intensity. In this example, we will operate the Lucent360™ with four side modules at 365 nm light at 4 different light intensity settings. The light intensity for each side module is independently set at 25%, 50%, 75% and 100% and the bottom LED is not in operation. Using the multi-light screening holder allows each quadrant to be operated independently without any interaction with the light from the other quadrants. For the 4 ml vial screener, up to 4 reactions can be performed in each quadrant (16 total). The multi-light screener allows you to either screen identical reactions conditions for each wavelength or design a custom array optimized for each wavelength. For this example, we will screen a set of the same 4 reactions conditions at each light intensity of 365 nm. The Lucent360™ temperature control unit maintains a constant and controlled temperature at all positions in the array. For this example, we will run all of the reactions at 30 °C. This prevents temperature increases due to irradiation of the LED’s or from internal exothermic processes. The device can be operated from 0-80 °C.
Experiment
We set out to investigate the photochemical version of the Arbuzov reaction, the reaction of an alkyl halide and a trialkyl phosphite to make an alkyl phosphonate. (Ref 1) In our example, the reaction of iodoanisole and triethylphosphite and triethyl amine. Previously we established 365 nm as the optimal wavelength for this reaction.
Protocol
The reactions were performed in a Lucent360™ equipped with 4 different light intensities at 365 nm at 25%, 50%, 75% and 100% intensity using the multi-light screening module. The external chiller was set to 30 °C. In each 4 ml vial with crimp cap and 2×7 nm stir bar were placed two coupling components, p-iodoanisole (1 equiv.), and triethylphosphite (2 equiv.) with triethylamine (2 equiv.) and 2 ml acetonitrile. In two experiments, each wavelength was tested at concentrations of coupling components ranging from 0.025 M to 0.8 M keeping the stoichiometry constant. The reactions were prepared in glove box under N2 atmosphere with sparged acetonitrile and kept in the dark until placed in the Lucent360™. The reaction was run for 3 hours with periodic pausing of lights to remove aliquots for analysis.
Product Analysis
At each desired time point, a 50 µL aliquot of each reaction was removed via syringe and diluted to 50 µM in DMSO for LC-MS analysis. The identification of products and impurities were determined by MS. Quantification of all products was determined by DAD in comparison to calibration standards of anisole diethylphosphonate.

Results and Discussion
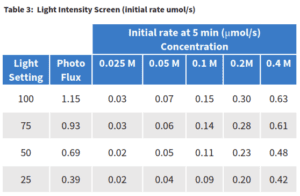
The phosphonate reaction was performed in the Lucent360™ to screen photon flux Intensities at multiple concentration of coupling parts. Each reaction was analyzed at 5 minutes to determine the initial product formation and initial rate for the purpose of determining an initial quantum yield for the reaction. Then, each reaction was then allowed to run for 3 h and the final product formation was determined.
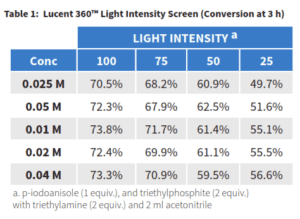
 At the completion of the reaction, higher product conversion was observed for the highest light intensity settings at each concentration. For example at 0.4 M, 73% product was observed at 100% compared to 56% for 25% light setting. For each of the highest three light intensity settings little difference was observed based on concentration. However, at the lowest setting and concentration we start to see a larger range which may suggest that we are at the limit where there is insufficient light to catalyzed the reaction efficiently. The effect of screening photon flux Intensities on the phosphonylation is further evident when looking at the initial rate of product formation of the reaction. In order to better understand the role of light on the reaction, first we need a better idea of how much light is present in each sample.
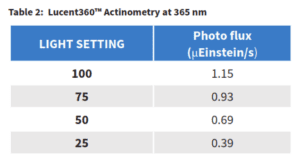 Chemical actinometry was performed based on the method reported here (Ref 2) to determine the photon flux for each light intensity setting in the Lucent360™ for the 365 nm lights. Photon flux (the amount of photons that will be received by a reaction sample) is highly dependent on reactor design, light orientation, wavelength and intensity, vial size and distance from the light source. As such, in order to accurately determine the photon flux in any sample, it is necessary to per-form the chemical actinometry in identical conditions as those for the chemical reaction of interest. In our case, the chemical actinometry was performed using the multi-light screen with 2 ml of solvent in 4 ml vial under identical Lucent 360 parameters For this experiment, the photon flux ranges from 0.39 μEinstein/s at the 25% setting to 1.15 (μEinstein/s) at 100%. With the photon flux determined, we now know the moles of photons per second that are present in each of our samples at each light intensity. Using our initial rate of product formation from Table 3, we know the moles of product formed per second along with the photon flux allows us to calculate directly the moles of product that are formed for each moles of photons added to the reaction. This represents the quantum yield of the reaction setup.
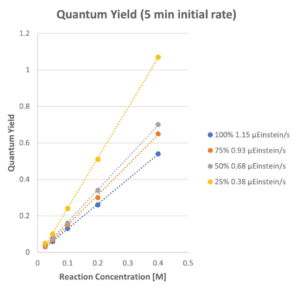 Interestingly, we found a concentration effect on the observed quantum yield. For screening photon flux Intensities, the determined quantum yield is linear with respect to the concentration of the reaction. Currently, we do not have an explanation for what is driving this effect in the phospho-nylation reaction and further mechanistic study would be necessary to under the roles of each coupling partner, base and concentration in utilizing the light intensity to drive this chemical reaction. Understanding the quantum yield and photon flux driving a reaction are important parameters when deciding how to scale up a reaction. We will utilize the optimal light intensity settings from this study and demonstrate further utility of the Lucent360™ to study:
- Temperature
- Batch scale up
- Flow
References (1) This reaction was demonstrated in flow by chemists Bruno Schiavi and Damien Thevenet Oril Industrie –Bolbec –Normandy –Affiliated with Les Laboratoires Servier , France and Philippe Jubault, Romain Lapierre, Thi Minh Thi Le and Thomas Poisson, IRCOF, COBRA Laboratory UMR6014, Rouen, Normandy, France. (2) Chemical actinometry method:https://hepatochem.com/standard-ferrioxalate-actinometer-protocol/

